What information will I find in the BMJ Best Practice Evidence Tables?
Throughout all of BMJ Best Practice, we aim to highlight evidence that is clinically relevant and accessible, important to patients, up to date and potentially practice changing. Our evidence tables focus on this type of evidence too. They summarise high-quality systematic reviews and evidence-based guidelines but only where there is clear reporting on:
- A relevant and important clinical question
- Data on effect size for an intervention versus a comparison
- A GRADE assessment for individual outcomes.
Go to the Evidence section in our Type 2 diabetes in adults topic to view an example of one of our evidence tables. This can be found in the ‘Resources” menu at the top of the topic page.
Clear clinical question
In order to practise evidence-based medicine, we need to firstly translate an information need into a relevant and clear clinical question.[Sackett DL. Evidence-based medicine. Semin Perinatol1997;21:3–5] That is why the first row in our evidence tables always contains a clinical question. To increase the benefit to patients and health care practitioners, we have only selected questions that have been answered in high-quality systematic reviews and evidence-based guidelines, some of which have involved patients in their development processes. Each question is related to relevant information in a topic in BMJ Best Practice. You’ll also see the clinical question in a pop up box if you click on the Evidence score in the relevant BMJ Best Practice topic.
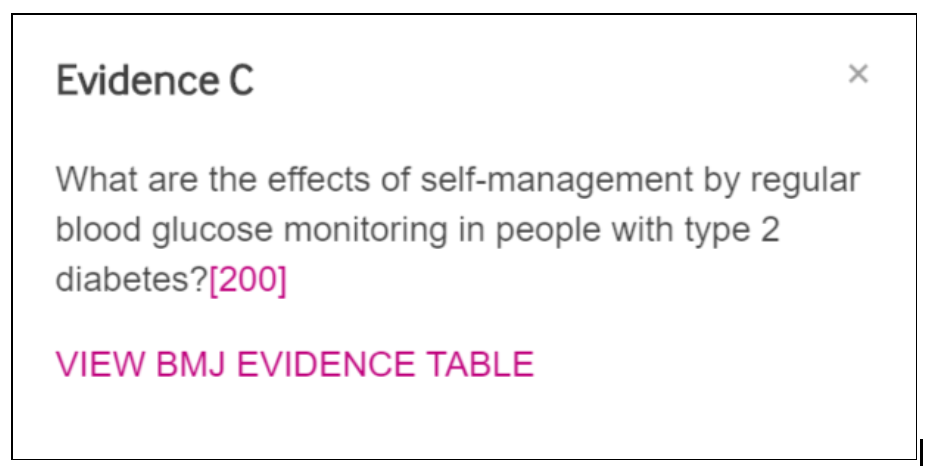
Example Evidence Score pop up including the clinical question
Created by BMJ Knowledge Centre
Each clinical question is referenced by a single systematic review or evidence-based guideline.
Evidence score
You will see the BMJ Best Practice Evidence score highlighted at the top of the table. The score is a simple A, B or C rating. See below for more information on the score, what it means and how it has been calculated.
The Evidence score and the link through to its associated evidence table is also placed next to relevant text in the BMJ Best Practice topic.
PICO
We have used a PICO approach to answer an important clinical question. Our evidence tables include a row underneath the clinical question stating the ‘P’, ‘I’ and ‘C’ components of the clinical question.
- ‘P’ represents the Population being covered
- ‘I’ represents the Intervention
- ‘C’ represents the Comparison
- ‘O’ represents the Outcomes of interest – these form the main body of the table.
Knowing the PICO helps you to check on the relevance of the evidence to the individual patient and clinical setting.
The outcomes (‘O’ in the PICO) are listed in the main body of the table in separate rows for transparency. The tables may not include every outcome reported in each study, especially where the researchers have added data from subgroup analyses. Instead the tables focus on the most important patient-related outcomes. These are usually either reported as ‘primary outcomes’, or ‘critical or important outcomes’. We aim to include ‘Adverse events’ where these have been reported by the study. It is important that potential harms are considered along with benefits when making clinical decisions on which interventions to use.
Treatment effectiveness and GRADE
Alongside each outcome included in the table are two columns which show:
- The BMJ Best Practice effectiveness level, showing the direction of effect
- GRADE, to show the level of confidence in that effect.
Effectiveness categories are allocated by the BMJ Best Practice evidence team, who review the statistical data on effect reported in the systematic review or guideline. Systematic reviews and guidelines often present these data in tables, and where meta-analyses have been carried out, in forest plots. Typically, the relative effect of an intervention versus a comparison is reported as relative risk (RR), odds ratio (OR) or mean difference (MD), each with an associated 95% confidence interval (95% CI). For simplicity, to allow a quick assessment of the direction of effect, we have translated this numerical statistical data into the following categories:
- Favours intervention
- Favours comparison
- No statistically significant difference
- Unknown effectiveness
It is important to note that these categories are based on statistical significance. This shows that results are unlikely to be due to chance, but this does not necessarily translate to clinical significance. Sometimes, for instance, the tables may include ‘‘No statistically significant difference ‘’ for a particular outcome, but a deeper delve into the evidence in the original report may still lead to a recommendation of one treatment over another. A small statistically insignificant effect could be considered ‘clinically important’. Where this is the case a footnote in our evidence table will briefly explain what the recommendation or authors’ conclusion was based on. More detail can be found for those who want to delve further by clicking on the links to the original report via our table.
The column for GRADE includes one of four possible ratings as follows:
- High: The authors are very confident that the true effect is similar to the estimated effect.
- Moderate: The authors are moderately confident that the true effect is likely to be close to the estimated effect.
- Low: The authors have limited confidence in the effect estimate and the true effect may be substantially different.
- Very low: The authors have very little confidence in the effect estimate and the true effect is likely to be substantially different.
The BMJ Best Practice evidence tables include the GRADE assessment as reported by the researchers in the source systematic review or guideline. The GRADE assessment helps gauge the certainty in the evidence on the effectiveness for each outcome compared with the comparison, i.e. how much we can trust the result. It follows a systematic process, although different assessors may reach different decisions on assessment results, so this is usually done by more than one person so a consensus is reached. For more information on GRADE, see ‘What is GRADE?’
Guideline recommendations and important notes
When a guideline has been used as the basis of an evidence table you will see a row in the table for the relevant ‘Recommendations as stated in the source guideline’ associated with the evidence in the table. This is extremely useful when unpicking how the evidence has been interpreted for clinical guideline recommendations. Some tables also have a row for additional notes, which may help explain the ‘evidence to recommendations’ process further. The notes may also help clarify the overall BMJ Best Practice evidence score rating.
Full text source for the original systematic review or guideline
Each table will always include a link to the full text of the original study that our tables are based on. BMJ Best Practice evidence tables provide a simple summary of the key outcomes to help you extract information quickly. The full text link allows you to look at the detail in the original source if you need more detail, for instance, on the numerical data.
How do we calculate the Evidence Score?
The evidence tables include an overall BMJ Best Practice Evidence Score determined by the BMJ Best Practice Evidence team. The score is a simple rating (A, B or C) that reflects the certainty in the evidence, as follows:
A = Confidence in the evidence is high or moderate to high
B = Confidence in the evidence is moderate or low to moderate
C = Confidence in the evidence is low or very low
The Evidence Score is based on the GRADE assessment reported in the original source. However when deciding the overall Evidence Score, the BMJ Best Practice Evidence team takes into consideration the strength of the recommendation (if the evidence is from a guideline), GRADE for primary or critical outcomes as well as the overall GRADE for all outcomes.
Each Evidence Score is accompanied by text which explains the confidence in the evidence and an additional effectiveness statement which gives further information on the overall direction of effect. The effectiveness statements are as follows:
- More effective/beneficial than the comparison
- No difference in effectiveness
- Less effective or likely to be more harmful
- Trade-off between benefits and harms
Notes included in the table also have been added to help further clarify how the decision on the Evidence Score was reached.